
2026 Global Country-State Cost of Living
2026-10-06
The 2026 Xpatulator Cost of Living Index ranks Monaco, Hong Kong, Singapore, and Switzerland as the world’s most expensive locations for expatriates. High housing costs, strong currencies, and import dependence drive the rankings, while currency shifts against the United States dollar and moderating inflation affect purchasing power. Expatriates are urged to evaluate cost-of-living differences carefully when negotiating international assignments, using tools such as Xpatulator’s Salary Purchasing Power Parity Calculator to maintain living standards.
Xpatulator’s Country and State cost of living ranking as at 1 October 2026 places Monaco 1st with an overall weighted Cost of Living Index of 139.8, followed by Hong Kong, China 2nd at 119.5 and Singapore 3rd at 116.7. Switzerland ranks 4th at 104.3 and Norway 5th at 101.7. These five locations are more expensive than, or close to, the New York City benchmark of 100. New York City remains the comparison base but is not itself included in this ranking because it is classified as a city rather than a country, state or combined city country state location.
The ranking includes locations classified by Xpatulator as countries and states together with Monaco, Hong Kong and Singapore, which are classified as combined city country state locations. All ranking positions and quarterly movements referred to here are calculated only within this selected group.
Xpatulator compares equivalent expenditure across 13 basket groups weighted according to typical spending by international professionals and managers. Household accommodation carries the largest weighting at 30 per cent, followed by transport at 18 per cent and groceries at 16.5 per cent. The overall index therefore reflects an expatriate spending pattern rather than simply measuring consumer price inflation.
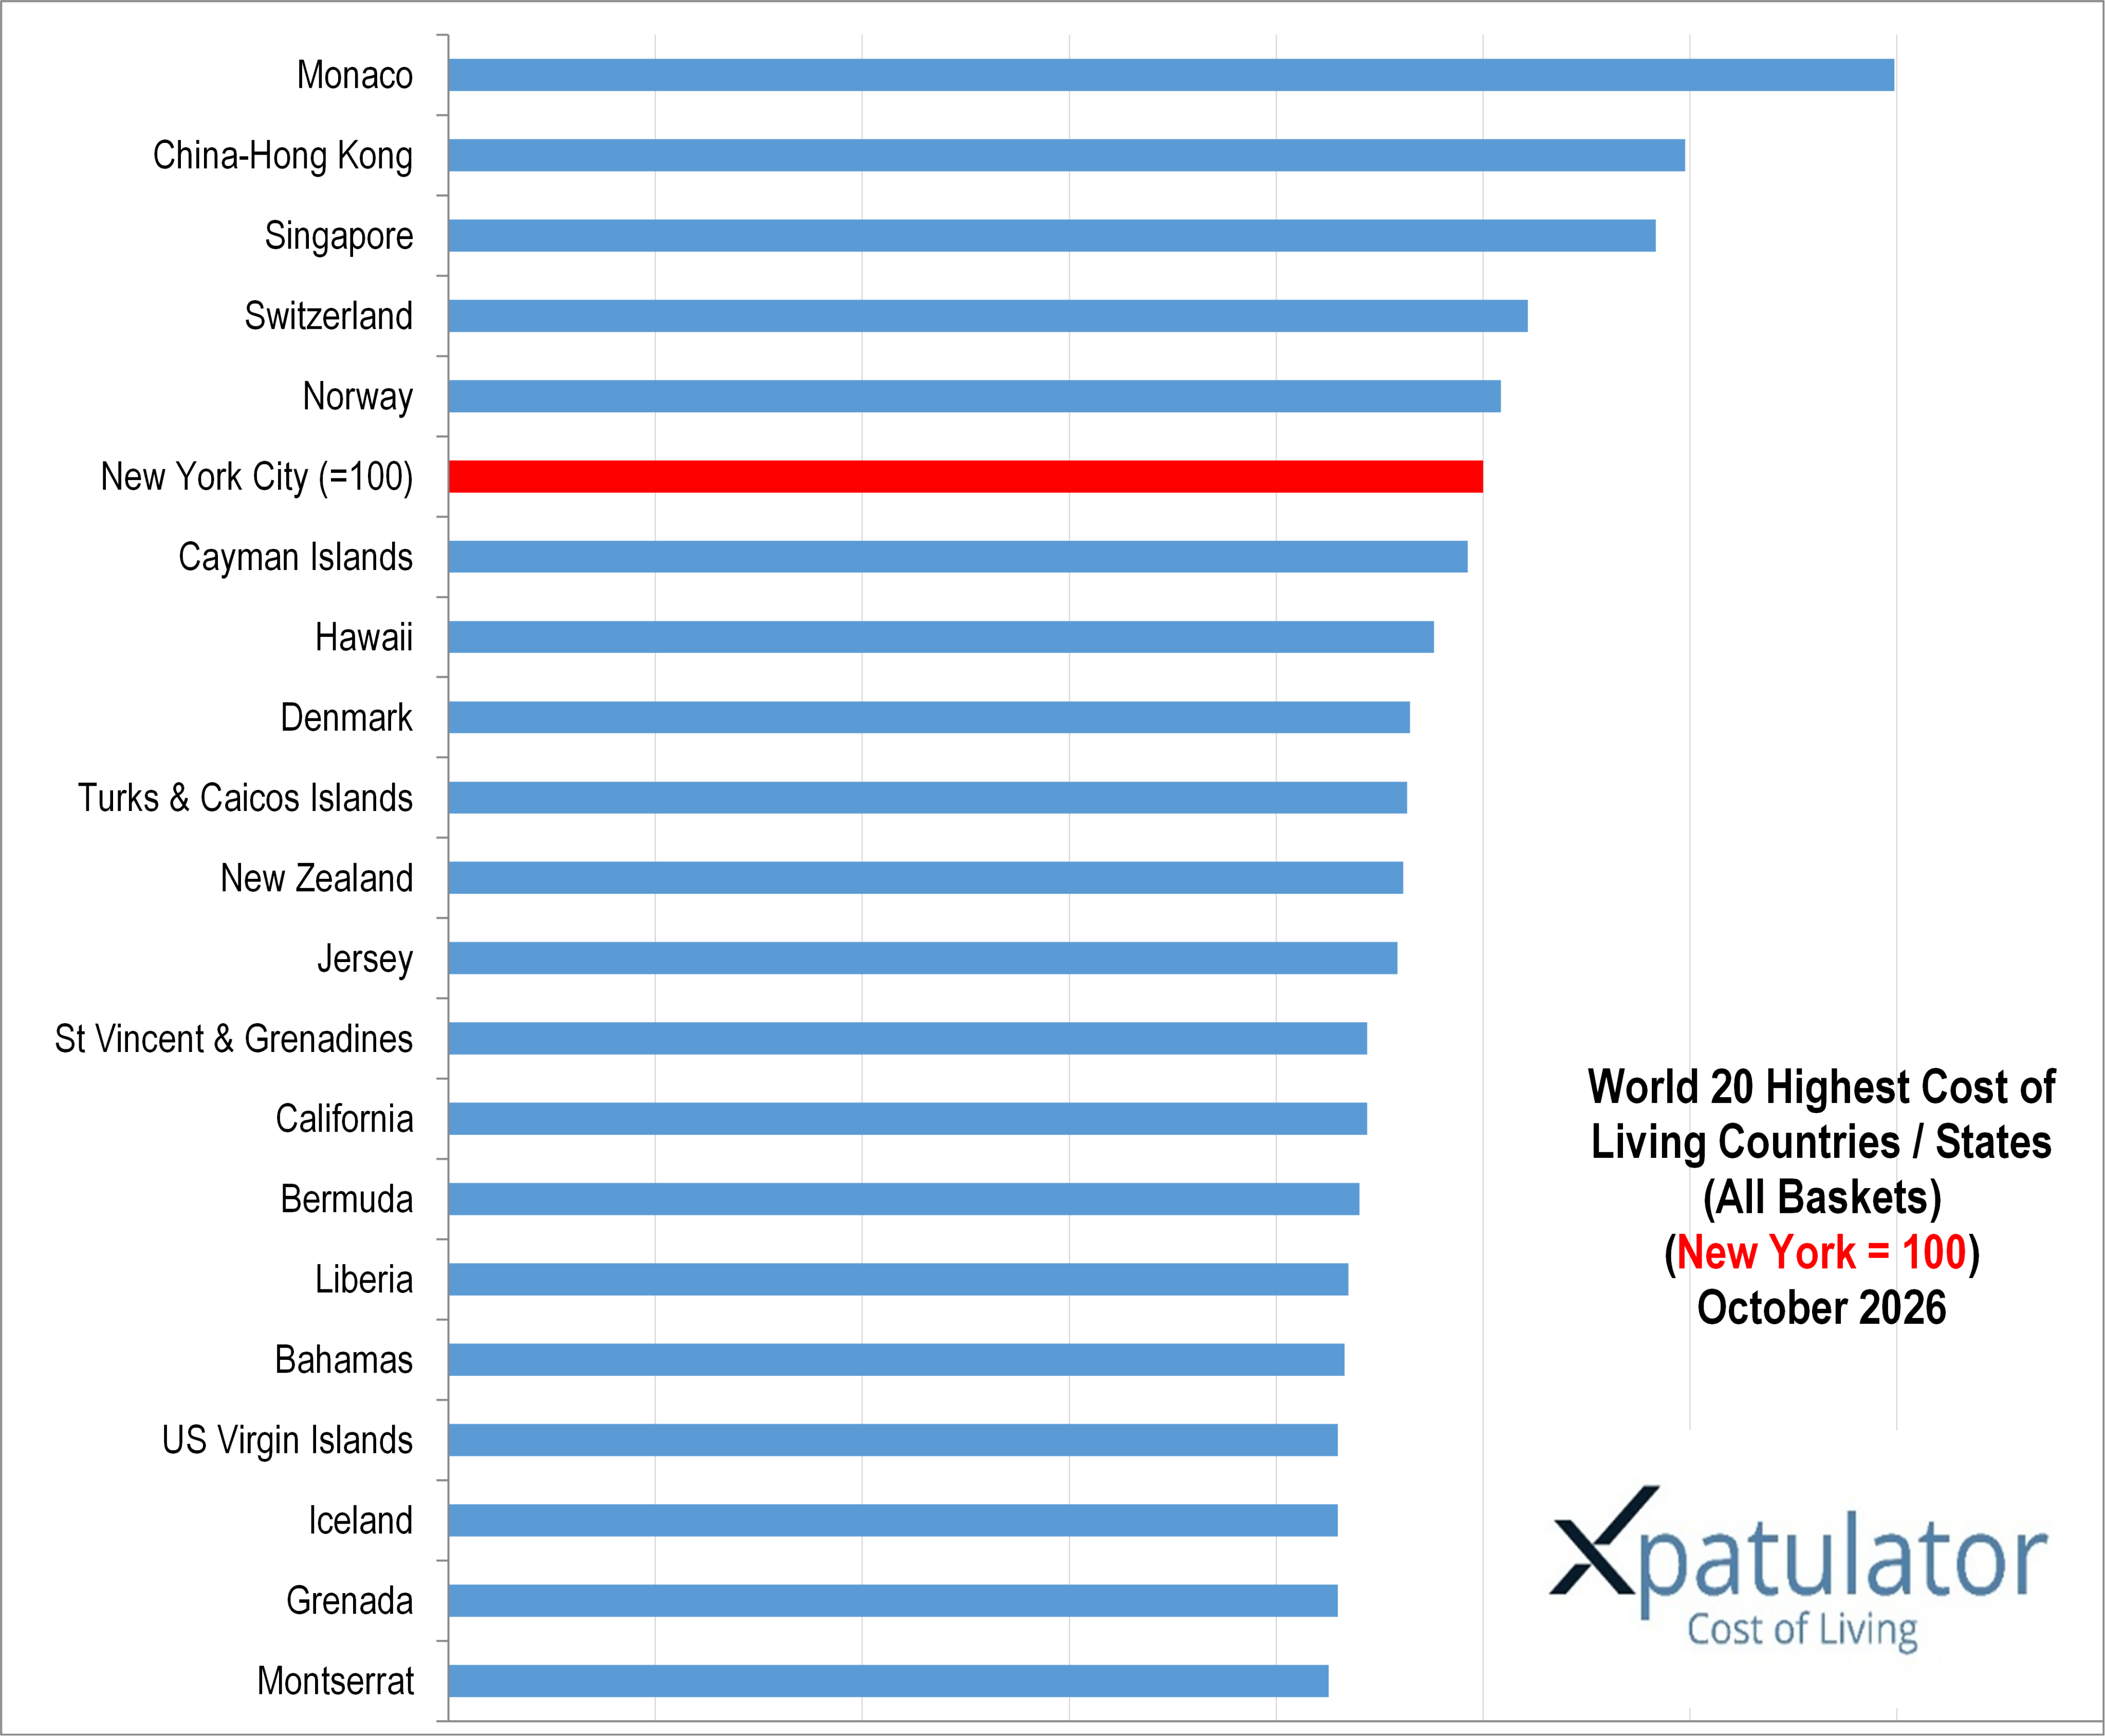
Monaco remains 1st, although its index declines from 140.8 in July to 139.8 in October. Its position reflects extremely limited land, high accommodation costs, sustained international demand and premium pricing for services. Housing is particularly influential in Monaco because suitable accommodation is scarce and carries the largest weighting in the Xpatulator methodology. The euro has also weakened against the United States dollar during recent months, with the European Central Bank reference rate at 1.1355 United States dollars per euro on 30 September. This reduces Monaco’s converted cost for someone earning United States dollars and is consistent with part of the quarterly index decline.
Hong Kong, China remains 2nd, with its index declining from 120.9 to 119.5. Housing remains the dominant pressure, with its accommodation basket substantially above the New York City benchmark. High density, limited land and demand for internationally suitable housing continue to support high costs. The Hong Kong dollar is linked to the United States dollar, which limits direct foreign exchange volatility and means changes are more closely related to local prices and individual basket movements.
Singapore remains 3rd, although its index falls from 117.9 to 116.7. Its high cost base reflects accommodation, personal care, transport, clothing and international education. Singapore inflation was 2.3 per cent in August, with higher airfares, transport services, clothing, personal care and food contributing to the increase. Import prices were also 15.6 per cent higher than a year earlier in August, driven particularly by oil. These pressures matter because Singapore relies heavily on international trade for energy and many consumer goods.
Switzerland remains 4th and Norway remains 5th, despite their indexes declining from 107.1 to 104.3 and from 104.6 to 101.7 respectively. Both are high wage economies where transport and labour intensive services are expensive. Switzerland also records high clothing and personal care costs, while Norway has particularly high furniture, household goods and transport costs. Currency movements can materially affect both locations when costs are converted into United States dollars, while domestic inflation and high wage structures sustain expensive local services.
The Cayman Islands remains 6th at 98.5. Its high communication, transport, clothing and grocery indexes reflect the structural cost of an island economy where a large share of consumption is imported. Freight, insurance and limited competition are incorporated into retail prices. A fixed relationship between the Cayman Islands dollar and the United States dollar reduces currency volatility, so local inflation and import costs have a more direct influence on the index.
Hawaii records one of the stronger quarterly movements, rising 3 places to 7th with an index of 95.3. Geographic isolation adds freight costs to groceries, furniture, vehicles and other goods, while housing, healthcare and education remain expensive. Denmark remains 8th at 92.9, where transport and paid services are important cost drivers.
The Turks and Caicos Islands rises 3 places to 9th at 92.7, while New Zealand’s ranking declines 3 places to 10th as its index falls from 96.0 to 92.3. The New Zealand dollar averaged about 0.589 United States dollars in September 2025 but was down to 0.564 on 30 September 2026, reducing the United States dollar converted cost of New Zealand expenditure. A weaker currency can, however, increase the local price of imports.
Jersey remains 11th at 91.7. Saint Vincent and the Grenadines rises 1 place to 12th and California rises 1 place to 13th, both at 88.8. Bermuda rises 2 places to 14th at 88.1 and Liberia rises 2 places to 15th at 87.0. The Bahamas rises 5 places to 16th, the United States Virgin Islands rises 6 places to 17th, Iceland declines 3 places to 18th, Grenada rises 5 places to 19th and Montserrat rises 2 places to 20th.
Island economies are prominent because imports, freight, insurance and relatively small retail and housing markets create structural premiums. Currency pegs remove some exchange rate risk but do not remove those costs. The Bahamian dollar, for example, is fixed at parity with the United States dollar.
Inflation has also become less uniform. Xpatulator’s international inflation analysis dated 5 October 2026 notes renewed pressure from energy, food and freight, with oil trading above 100 United States dollars per barrel during recent Middle East instability. Higher energy costs can spread through aviation, shipping, electricity, food production and distribution, with remote and import dependent locations particularly exposed. The same analysis emphasises that inflation and cost of living are not interchangeable because exchange rates and expenditure patterns can change relative purchasing power substantially.
For expatriates and global mobility specialists, the central question is therefore salary purchasing power rather than nominal salary. A larger salary can still leave an employee worse off if accommodation, transport, groceries, healthcare and education absorb a greater share of income in the host location. Comparing home and host costs before accepting an offer helps establish the salary and allowances needed to maintain purchasing power and reduces the risk of financial pressure after relocation.
Xpatulator’s Salary Purchasing Power Parity Calculator calculates an equivalent host salary adjusted for cost of living differences so that offers can be compared on purchasing power rather than salary alone.
Use Xpatulator’s Cost of Living Calculators and Tools to compare home and host locations, understand changes in purchasing power, and establish the salary, allowances and international assignment package required to maintain a comparable standard of living.